The ACCEL² project: modeling the 3D power spectrum

17 Sep. 2024 - Lyα telecon

 

Solène Chabanier, Corentin Ravoux, Lucas Latrille, Jean Sexton, Éric Armengaud, Julian Bautista, Tyann Dumerchat, Zarija Lukić


arxiv:2407.04473
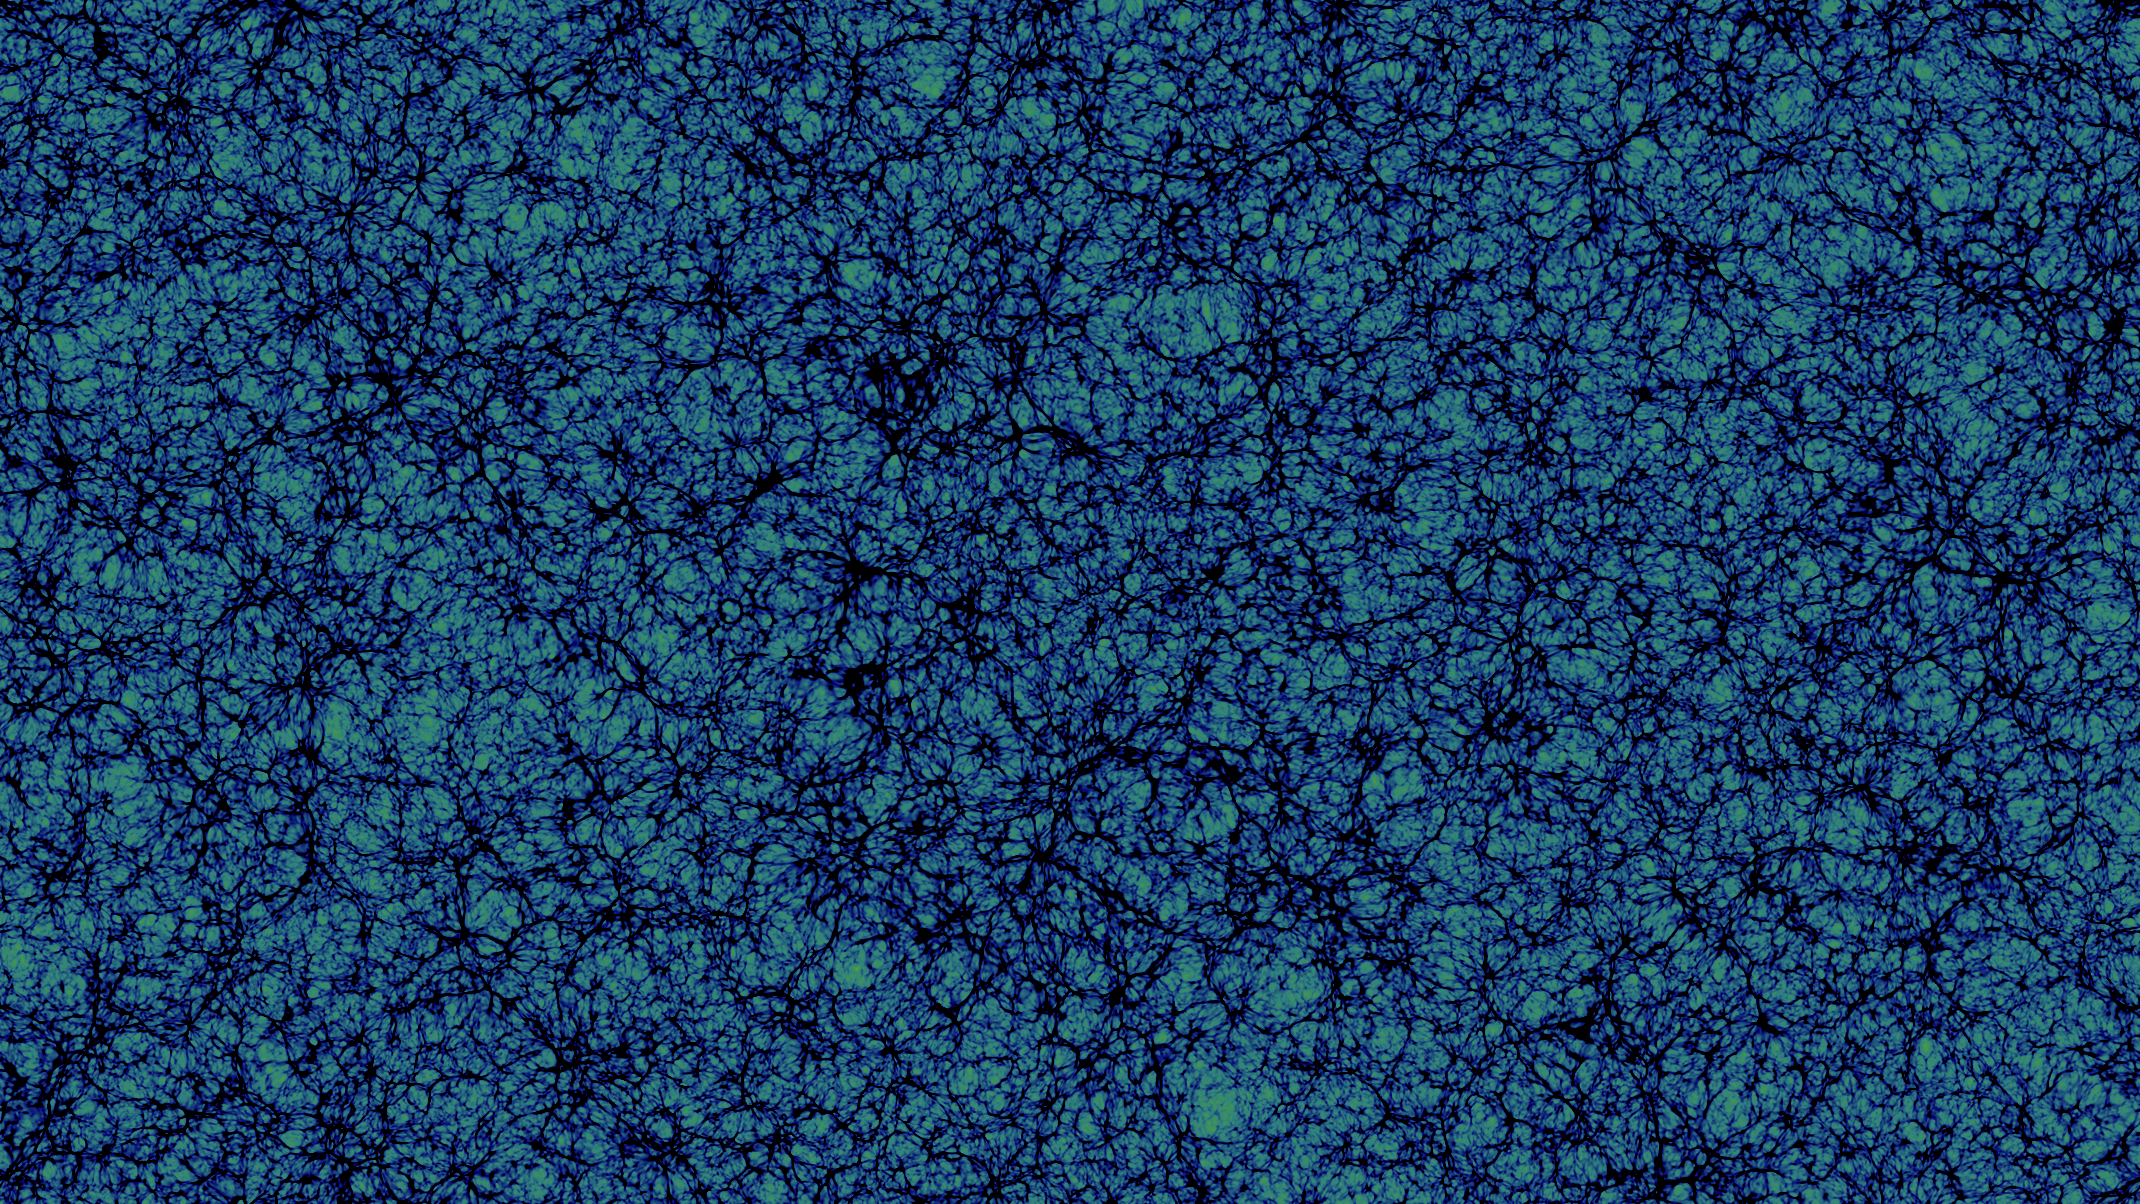
 

Lyman-α clustering

Quasar

Lyman-α forest

Observer

Corentin Ravoux                                                                                                                                                                     Lyα telecon - September 2024

Lyman-α clustering

Quasar

Lyman-α forest

\delta_F = \frac{F}{\langle F \rangle} - 1

= Fraction of transmitted flux

F

Correlation

\delta_{\mathrm{D}}^{(3)}\left(\vec{k}+\vec{k}^{\prime}\right) P_{3\mathrm{D}}(\vec{k}) = \frac{ \left\langle\delta_F(\vec{k}) \delta_F(\vec{k}^{\prime})\right\rangle}{(2 \pi)^3}

Observer

3D power spectrum

\theta
\mu = \cos(\theta)

Corentin Ravoux                                                                                                                                                                     Lyα telecon - September 2024

Project motivation

  • Objective: Improve Lyman-α forest modeling
  • One dimensional power spectrum (P1D):
    • Focus on small-scales (1-10 Mpc)
    • Require small, very-resolved hydrodynamical simulations
  • BAO with auto-correlation:
    • Modeled with linear theory (~100 Mpc)
    • Marginalization on non-linear parameters
  • Correct full modeling difficult to provide due to large range of scales
  • Create a "numerical laboratory" to study the full shape modeling of Lyman-α forest, starting with P3D

Corentin Ravoux                                                                                                                                                                     Lyα telecon - September 2024

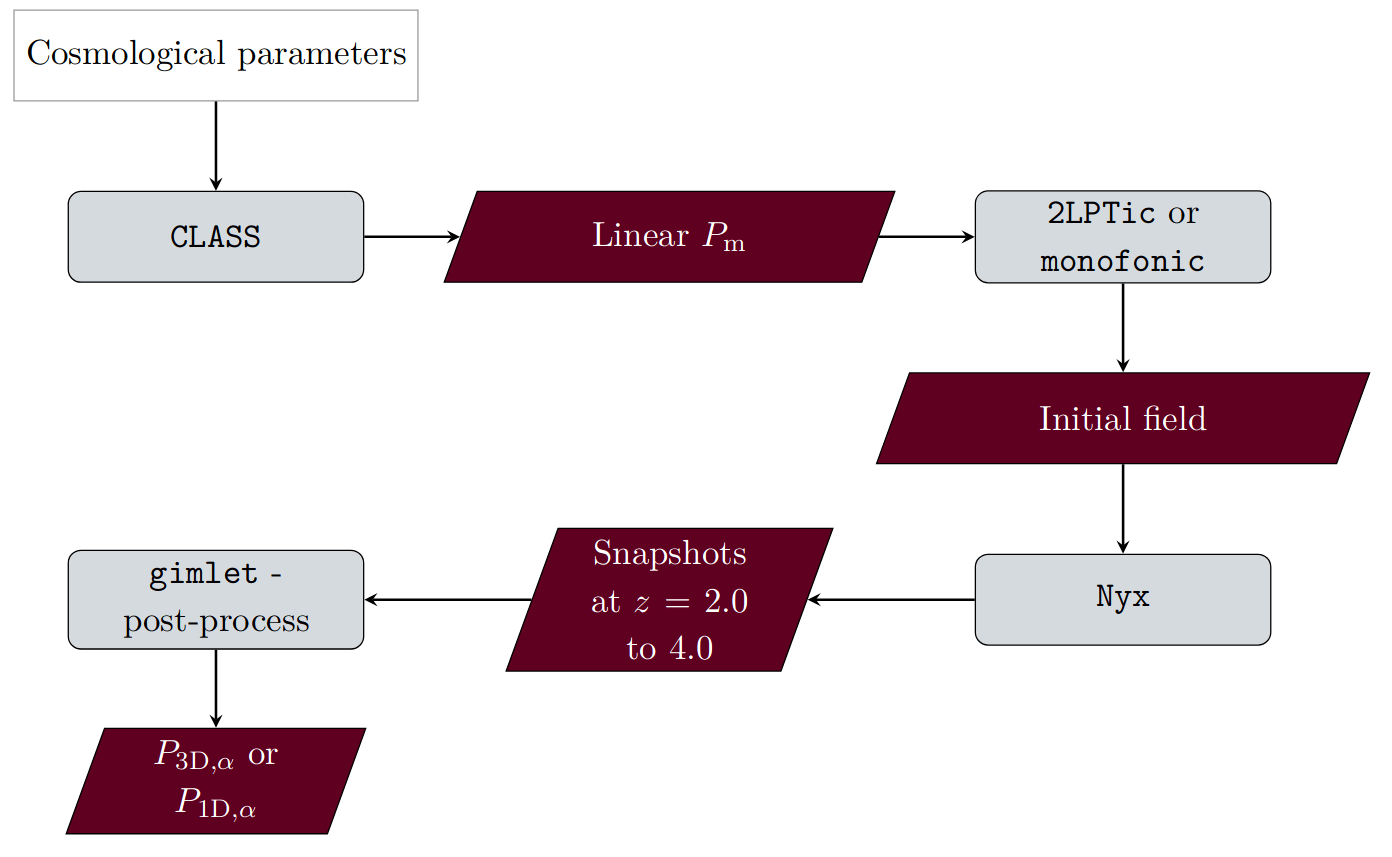
Hydro simulations

  • Nyx simulation code:
    • Dark matter particles with N-body and Particle Mesh
    • Baryons resolved with full hydrodynamic simulations
  • GPU version: highly vectorizable
  • Initialization with Zel'dovic approximation at z=200
  • Computation of P3D/P1D with gimlet (MPI code)
Corentin Ravoux                                                                                                                                                                     Lyα telecon - September 2024

The ACCEL² simulation suite
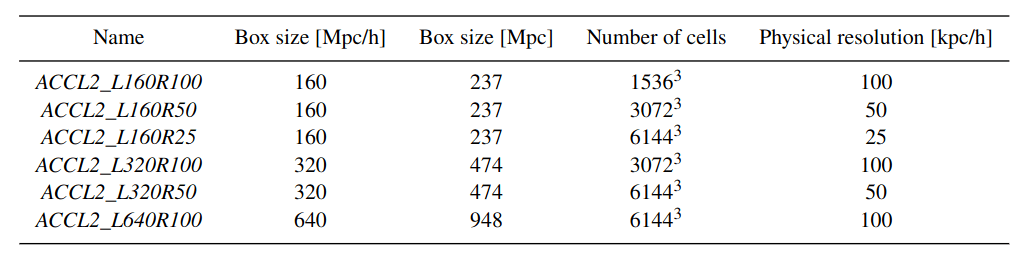
  • Simulation grid: [160 - 640] Mpc/h, Resolution range: [25 - 100] kpc/h
  • Proper modeling of Lyman-α forest needs a resolution four times higher than the Jeans scale (~25 kpc/h)
  • Time-varying, but spatially uniform, ultraviolet background
  • Rescaling of mean transmitted flux to match observations
  • One thermal history for now (can be done in post-processing)

Lukic et al. 2015, Chabanier et al. 2023

Corentin Ravoux                                                                                                                                                                     Lyα telecon - September 2024

Comparison with other simulations
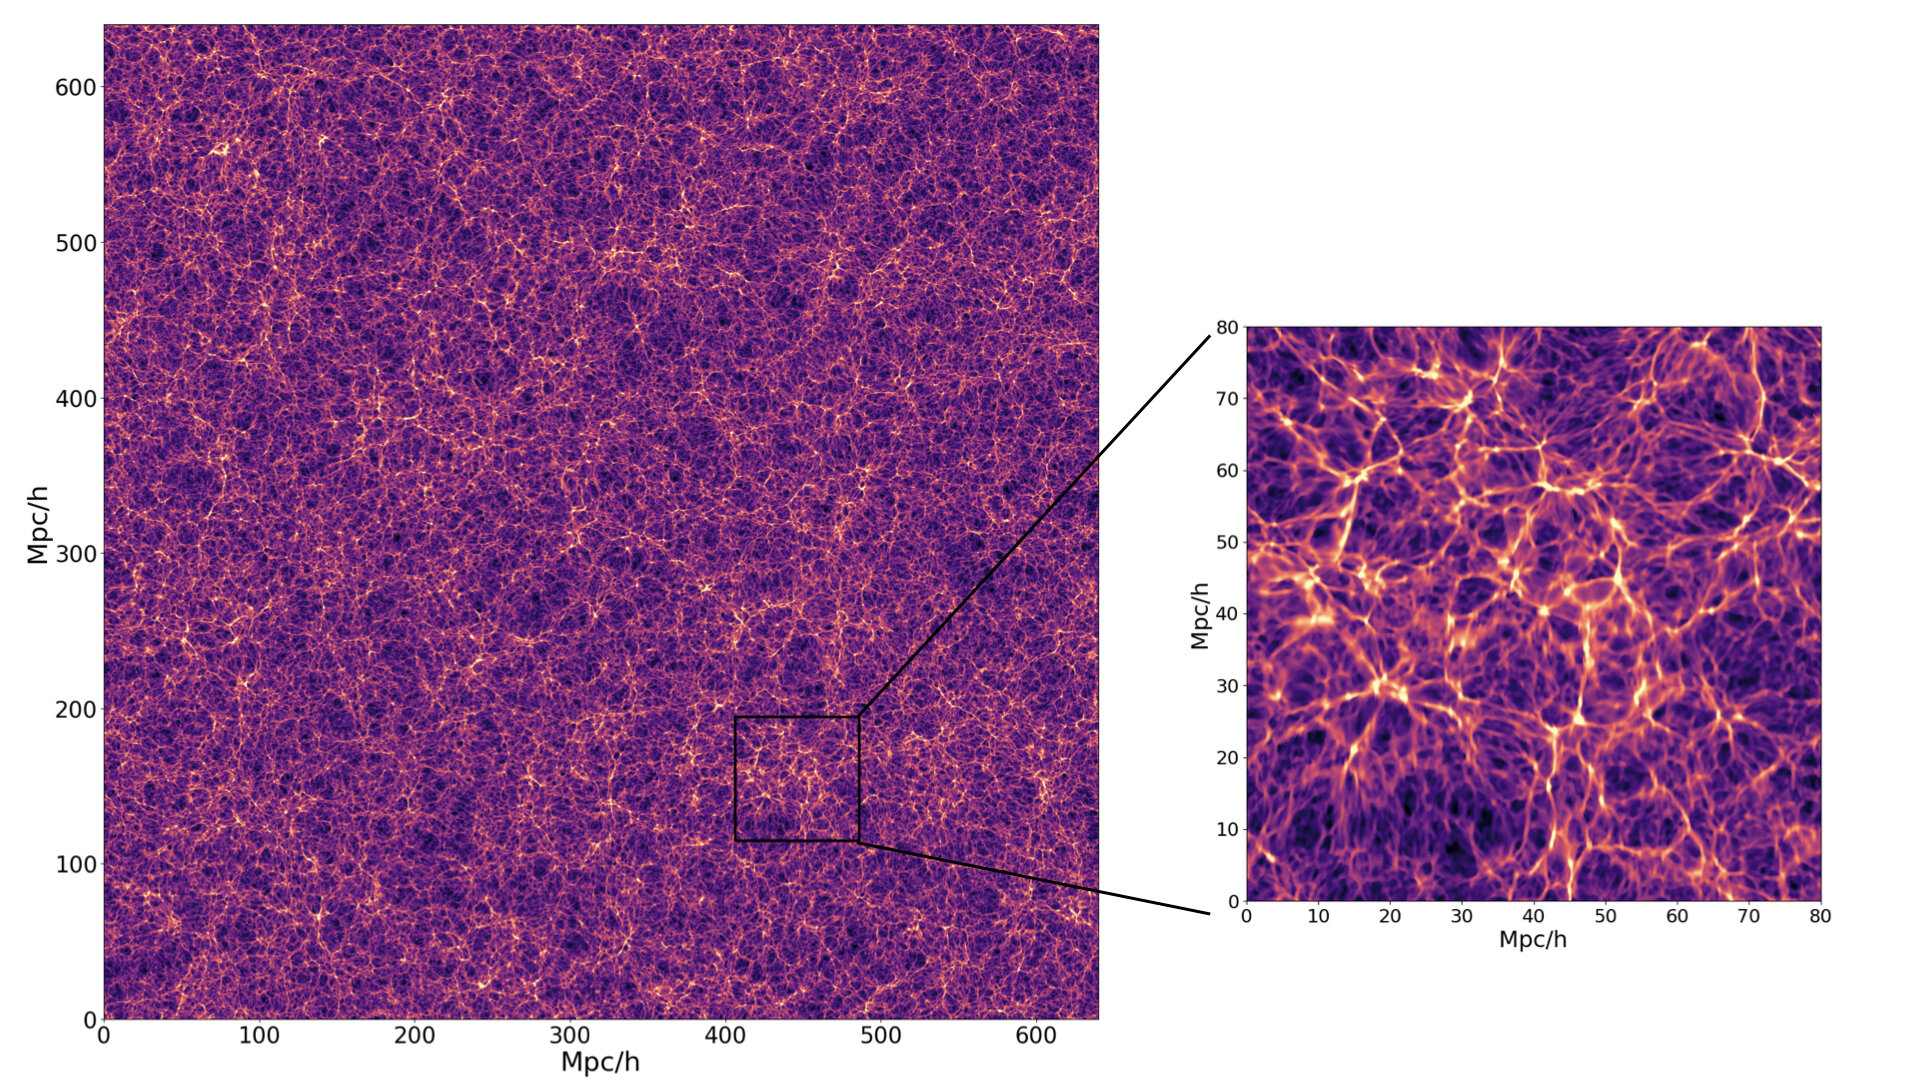
Largest hydrodynamical simulations with Lyman-α forest resolution

ACCL2_L640R100

Typical volume of P1D simulations

  • Sherwood:
    • 160 Mpc/h
    • 80kpc/h resolution
  • MillenniumTNG:
    • 500 Mpc/h
    • 115 kpc/h resolution
  • FLAMINGO:
    • 700/2000 Mpc/h
    • 200/400 kpc/h resolution

Corentin Ravoux                                                                                                                                                                     Lyα telecon - September 2024

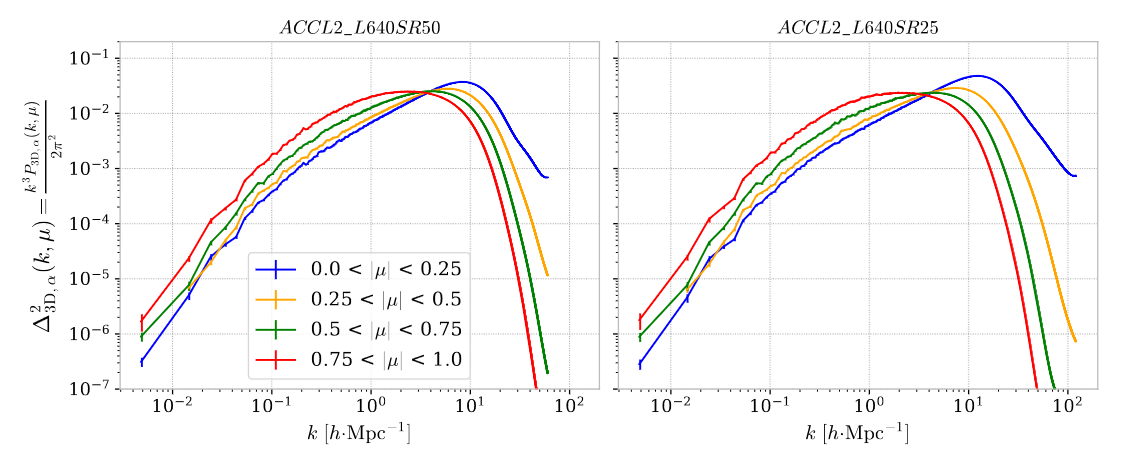
P3D from gimlet
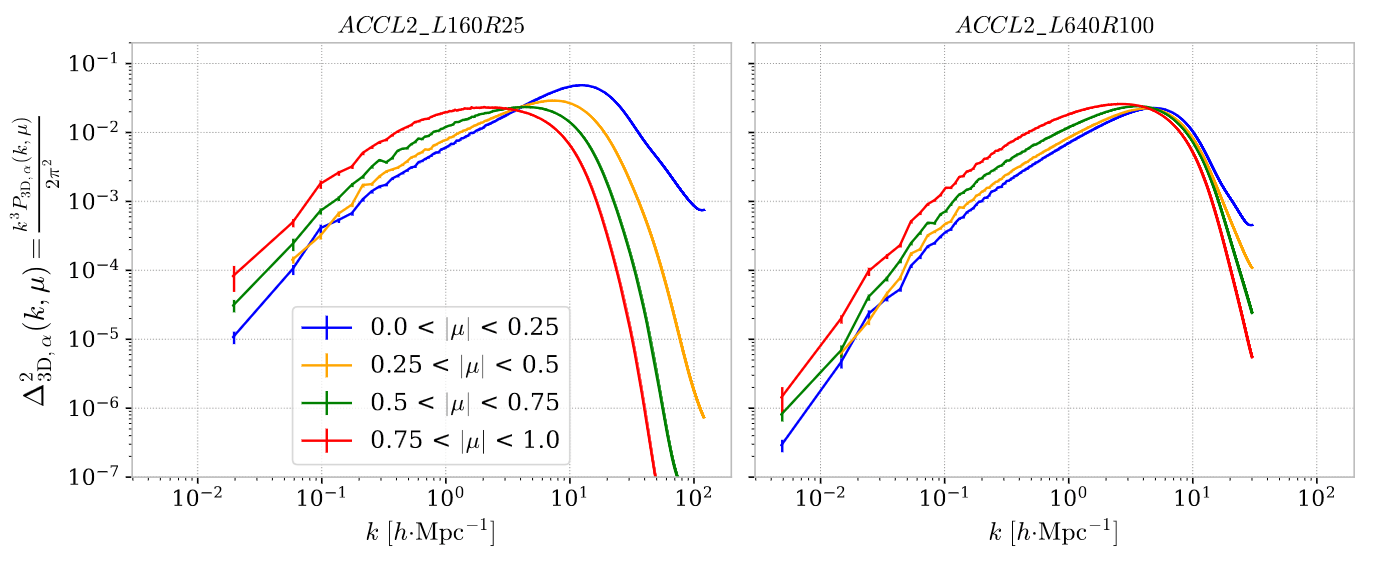
Best resolution

Largest simulation

  • P3D computed with the whole simulation volume in 3 directions
  • Profile caused by thermal broadening and Jeans smoothing

Corentin Ravoux                                                                                                                                                                     Lyα telecon - September 2024

Fit of the simulations

P_{\mathrm{model},\alpha}(k, \mu)=b_{\alpha}^2\left(1+\beta_{\alpha} \mu^{2}\right)^{2} P_{\mathrm{m}}(k) D(k, \mu)
D(k, \mu)=\exp \left\{ \left[q_{1} \frac{k^{3} P_{\mathrm{m}}(k)}{2 \pi^{2}} +q_{2} \left(\frac{k^{3} P_{\mathrm{m}}(k)}{2 \pi^{2}} \right)^{2}\right] \times \left[1-\left(\frac{k}{k_{\mathrm{v}}}\right)^{a_{\mathrm{v}}} \mu^{b_{\mathrm{v}}}\right] - \left(\frac{k}{k_{\mathrm{p}}}\right)^{2} \right \}

Lyman-α bias

  • P3D modeling along the work of McDonald 2003 and Arinyo-i Prats et al. 2015:

RSD Lyman-α parameter

Linear

= matter power spectrum from CLASS

Non linear

P_{\mathrm{m}}(k)

Corentin Ravoux                                                                                                                                                                     Lyα telecon - September 2024

Likelihood and error bars

\chi^{2}=\sum_{(k,\mu)} \frac{\left(P_{3\mathrm{D},\alpha}-P_{\mathrm{model},\alpha}\right)^{2}}{\sigma^{2}}\,
  • Minimization following Arinyo-i Prats et al. 2015:
\sigma(k, \mu)=P_{3\mathrm{D},\alpha}(k, \mu)\left[\frac{1}{ \sqrt{N(k, \mu)}}+\epsilon\right]\,
  • N = number of modes in the considered (k,μ) bin used for P3D calculation
  • Artificial ε term to avoid excessive weights to large k bins
  • No covariance considered, no cosmic variance due to IC

Corentin Ravoux                                                                                                                                                                     Lyα telecon - September 2024

Fit of the simulations
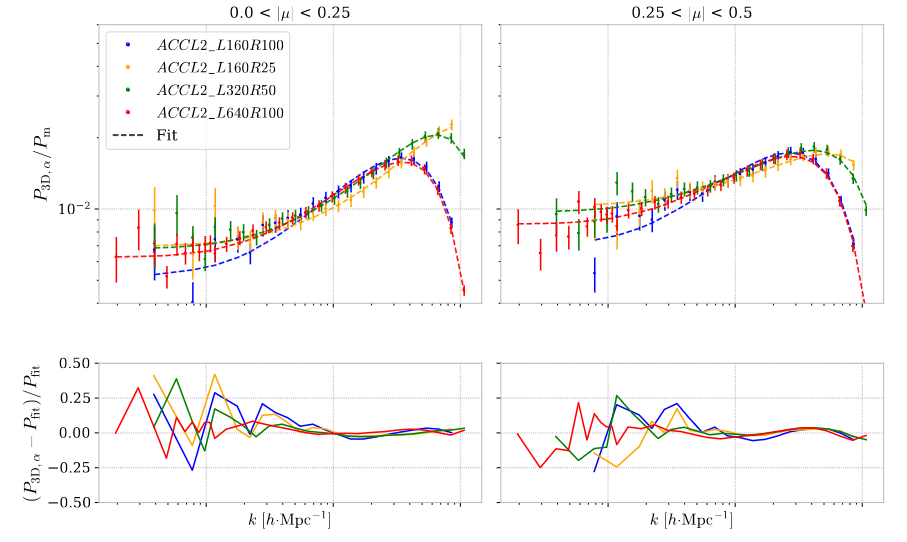
  • Rebinning of power spectrum at large wavenumber


Good fit quality for k < 12 h.Mpc-1 and for all grids

python package: https://github.com/corentinravoux/lyapower

Corentin Ravoux                                                                                                                                                                     Lyα telecon - September 2024

Results on linear parameters
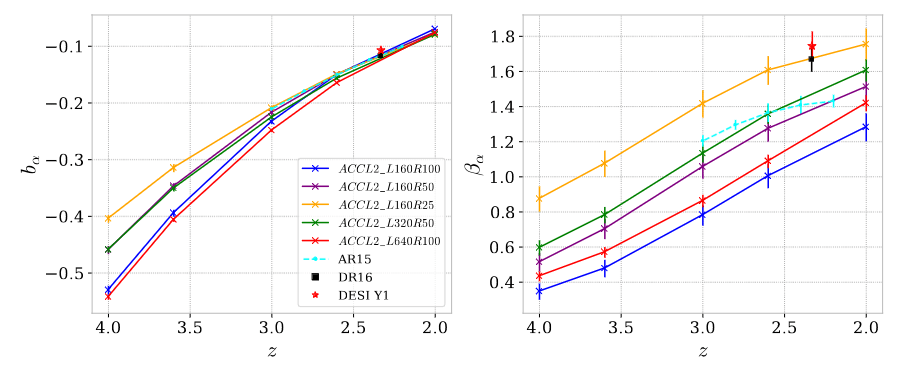
Physical resolution has more impact than the box size because of mode coupling

  • Variation of bias and RSD parameters as a function of redshift
  • Agreement for bias, large changes for RSD parameter

Corentin Ravoux                                                                                                                                                                     Lyα telecon - September 2024

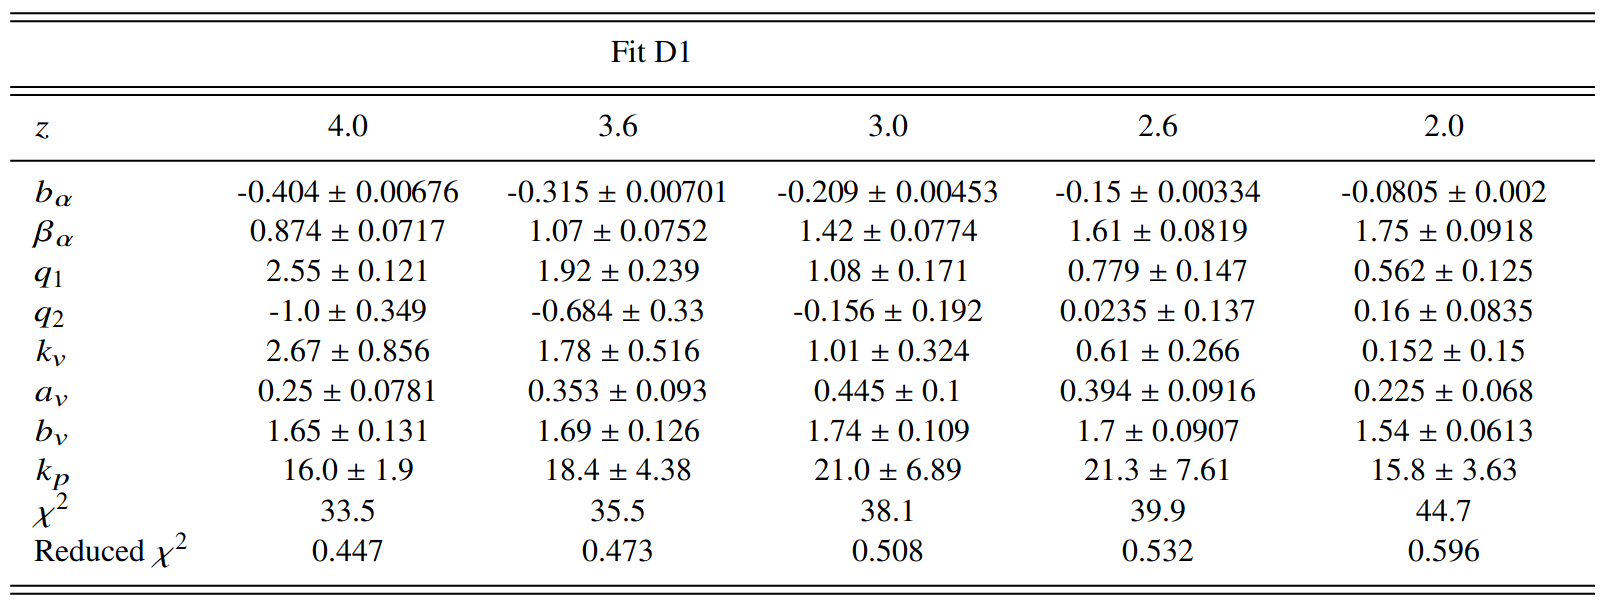
Best advised fit

Corentin Ravoux                                                                                                                                                                     Lyα telecon - September 2024
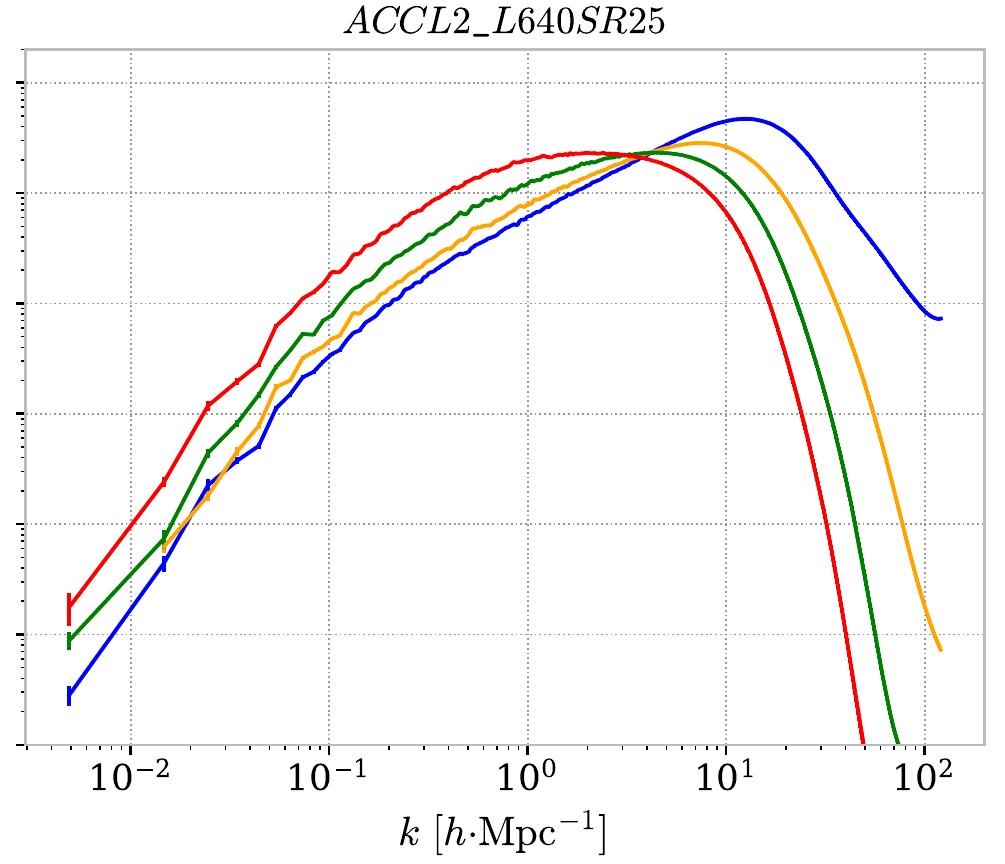
  • Numerical method to improve the resolution of large simulations

Best resolution

Largest simulation

Small low-resolution simulation for rescaling

  • Gives the best estimate of P3D

Splicing test

Small scales

Large scales
Corentin Ravoux                                                                                                                                                                     Lyα telecon - September 2024

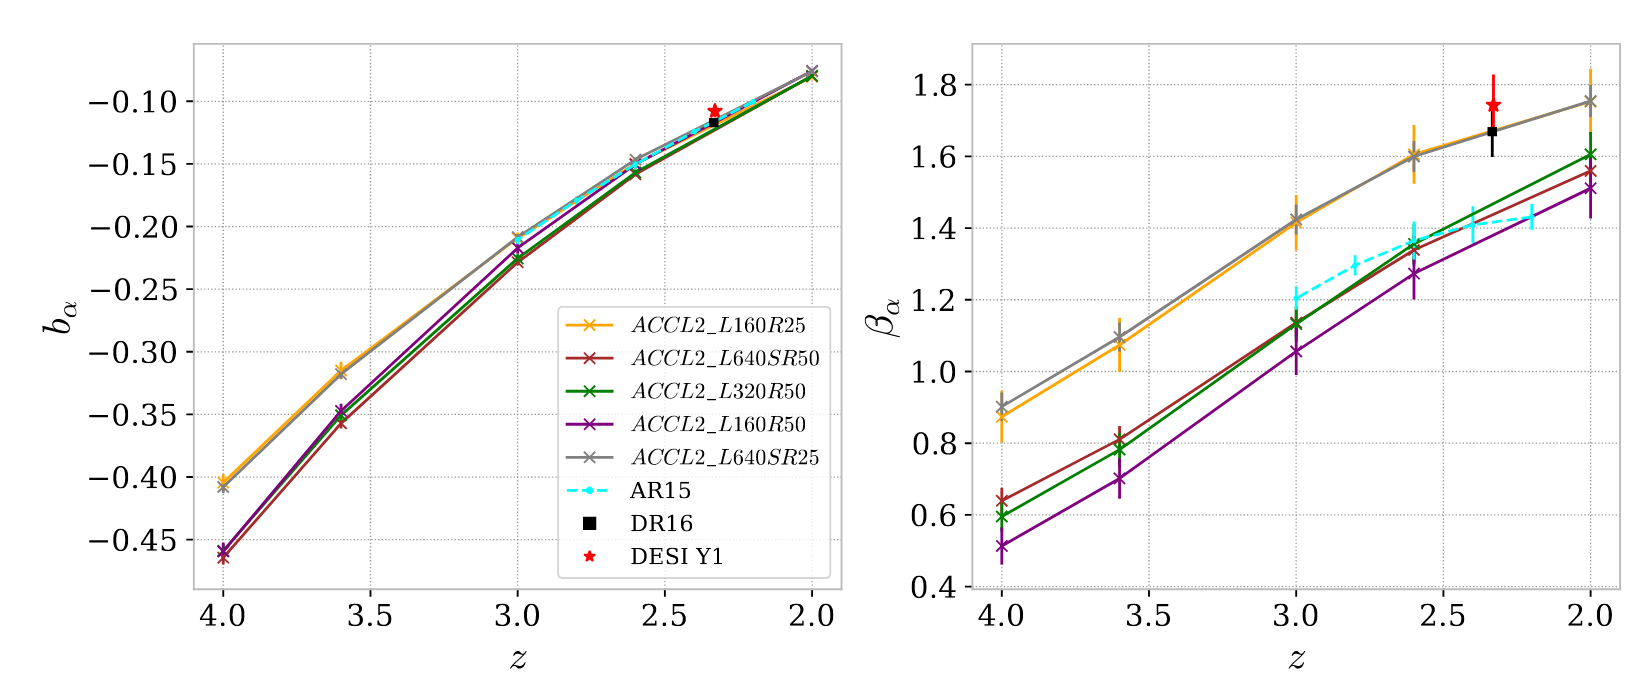
Spliced power spectra fit

Spliced P3D in agreement for linear parameters with the most resolved simulation

Corentin Ravoux                                                                                                                                                                     Lyα telecon - September 2024
BAO signal detection
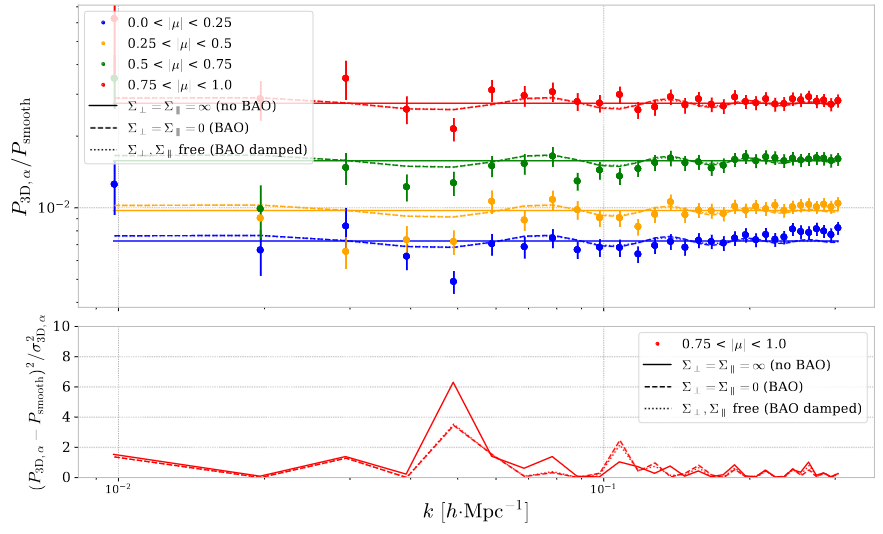
  • BAO measurement on our largest simulation


  • Decomposition of matter power spectrum in a BAO and smooth component

ACCL2_L640R100

Work performed by Lucas Latrille

Corentin Ravoux                                                                                                                                                                     Lyα telecon - September 2024

Details on BAO signal fit
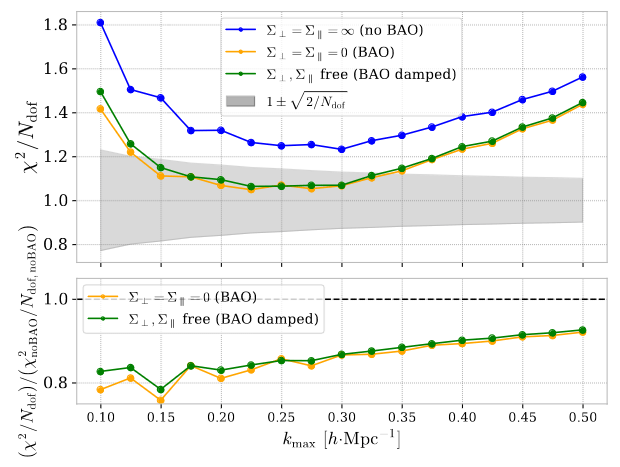
  • Fit linear models with/without BAO and with non linear damping
  • Variation of the maximal wavenumber used in the fit
  • χ² test gives p-value < 0.0006 for all maximal wavenumber

Clear BAO signal detection

Corentin Ravoux                                                                                                                                                                     Lyα telecon - September 2024

Fit of damping parameters
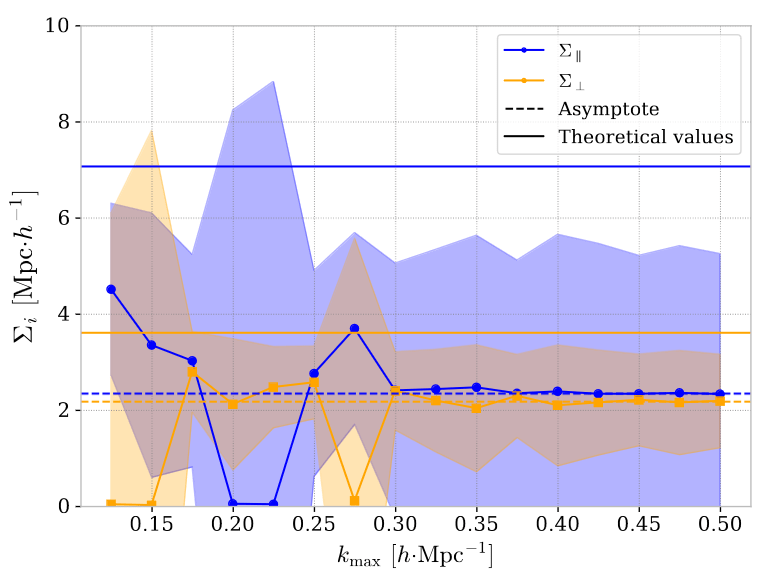
  • Damping of the BAO peak due to the non-linear growth of structures
P_m(k,\mu) = P_{\text{smooth}}(k) + P_{\text{wiggles}}(k) \times \exp \left(-\dfrac{k^2 \Sigma_{\text{nl}}^2(\mu)}{2}\right)
\Sigma_{\text{nl}}^2 = \Sigma_\parallel^2\mu^2 + \Sigma_\perp^2 (1- \mu^2)
  • First characterization on hydro simulations

Differences with theoretical values hard to interpret due to large error bars

Corentin Ravoux                                                                                                                                                                     Lyα telecon - September 2024

Started projects with ACCEL²

EFTofLSS at P3D level

Text

Roger de Belsunce

  • Fit of EFT model directly to the measured P3D
  • Improve constraints on EFT bias terms

EFTofLSS at field level

Kazuyuki Akitsu, Stephen Chen, Mikhail Ivanov

  • Fit by forward modeling method directly on the simulation Lyman-α field

Corentin Ravoux                                                                                                                                                                     Lyα telecon - September 2024

Conclusion

  • New simulation set available for Lyman-α WG
  • Resolution and box size impact on 3D power spectrum
  • New values for linear and non-linear P3D modeling
  • First characterization of BAO signal on hydro simulations

Full fit
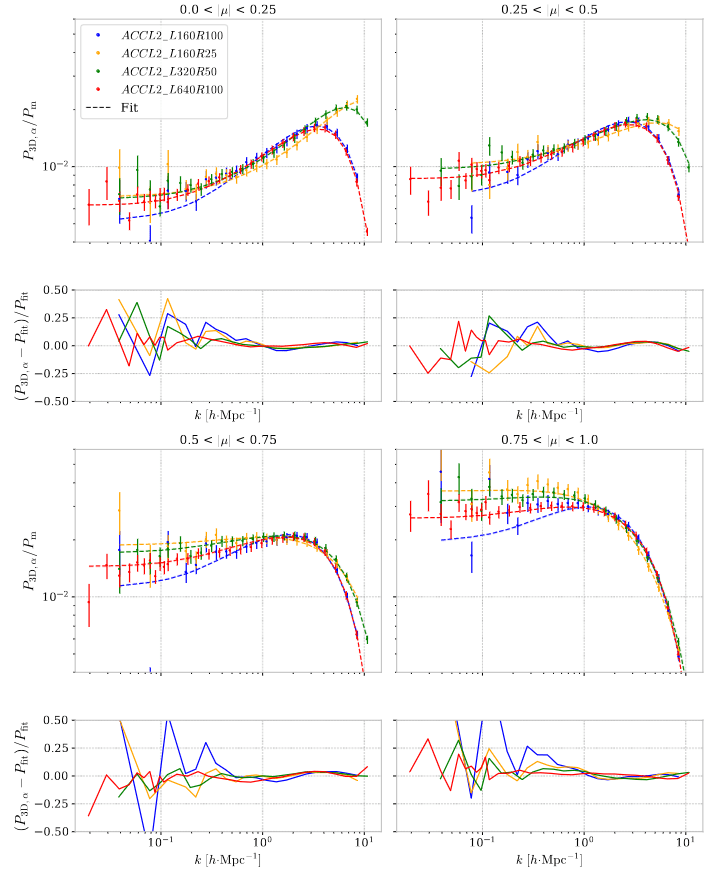
Use of other models
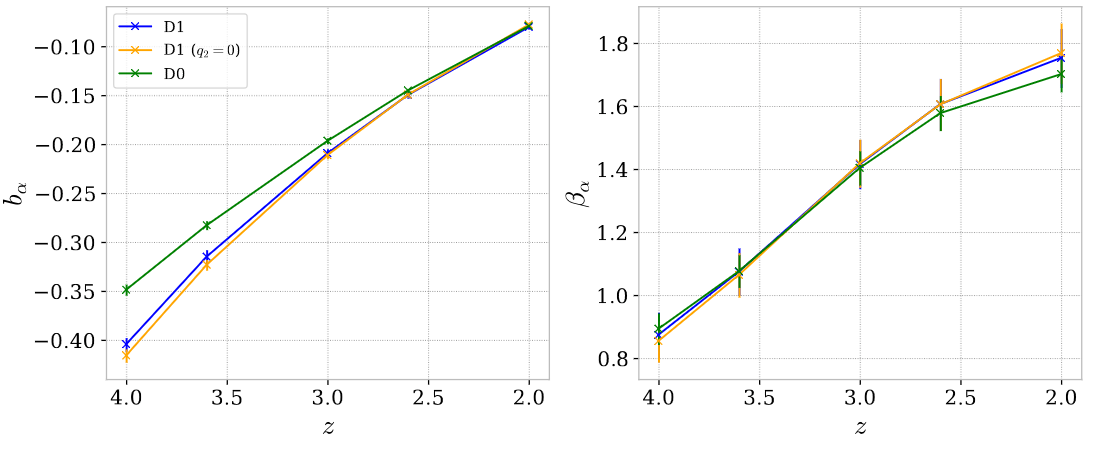
D_{0}(k, \mu)=\exp \left\{\left(\frac{k}{k_{\mathrm{nl}}}\right)^{a_{\mathrm{nl}}}-\left(\frac{k}{k_{\mathrm{p}}}\right)^{a_{\mathrm{p}}}-\left(\frac{k \mu}{k_{\mathrm{v0}}\left(1+k / k_{\mathrm{v1}}\right)^{a_{\mathrm{v1}}}}\right)^{a_{\mathrm{v0}}}\right\}
D_1(k, \mu)=\exp \left\{ \left[q_{1} \frac{k^{3} P_{\mathrm{m}}(k)}{2 \pi^{2}} +q_{2} \left(\frac{k^{3} P_{\mathrm{m}}(k)}{2 \pi^{2}} \right)^{2}\right] \times \left[1-\left(\frac{k}{k_{\mathrm{v}}}\right)^{a_{\mathrm{v}}} \mu^{b_{\mathrm{v}}}\right] - \left(\frac{k}{k_{\mathrm{p}}}\right)^{2} \right \}

Details on the splicing

P_{3\mathrm{D},\alpha}^{\mathrm{sp}} (k,\mu) = \begin{cases} P_{3\mathrm{D},\alpha}^{\mathrm{(L,Lr)}} (k,\mu) \dfrac{P_{3\mathrm{D},\alpha}^{\mathrm{(S,Hr)}} (k_{\mathrm{min}},\mu)}{P_{3\mathrm{D},\alpha}^{\mathrm{(S,Lr)}} (k_{\mathrm{min}},\mu)}, & \text{for } k < k_{\mathrm{min}} \,, \\[15pt] P_{3\mathrm{D},\alpha}^{\mathrm{(L,Lr)}} (k,\mu) \dfrac{P_{3\mathrm{D},\alpha}^{\mathrm{(S,Hr)}} (k,\mu)}{P_{3\mathrm{D},\alpha}^{\mathrm{(S,Lr)}} (k,\mu)}, & \text{for } k_{\mathrm{min}} < k < k_{\mathrm{max}}\,, \\[15pt] P_{3\mathrm{D},\alpha}^{\mathrm{(S,Hr)}} (k,\mu) \dfrac{ P_{3\mathrm{D},\alpha}^{\mathrm{(L,Lr)}} (k_{\mathrm{max}},\mu)}{ P_{3\mathrm{D},\alpha}^{\mathrm{(S,Lr)}} (k_{\mathrm{max}},\mu)}, & \text{for } k > k_{\mathrm{max}}\,. \end{cases}

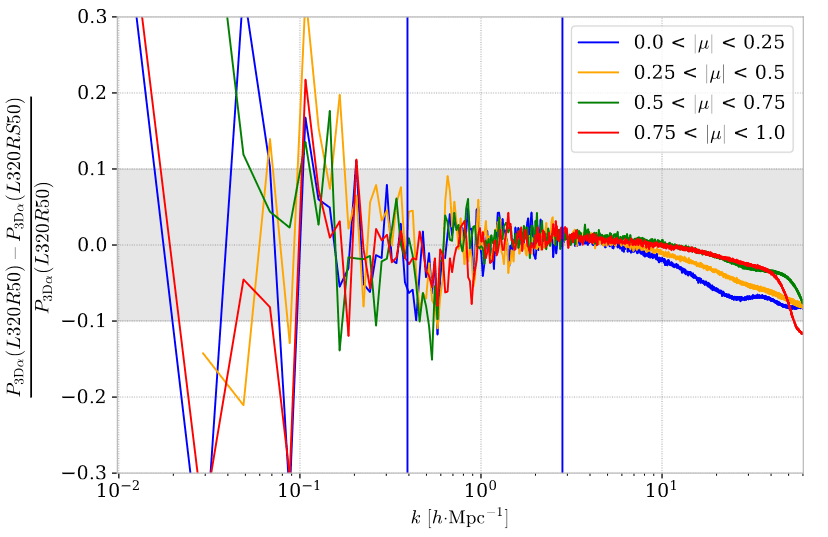
Splicing verification

  • Splicing can be verified in our grid
  • Splice of L320R100 and L160R50
  • Comparison with L320R50

Splicing verification for linear parameters
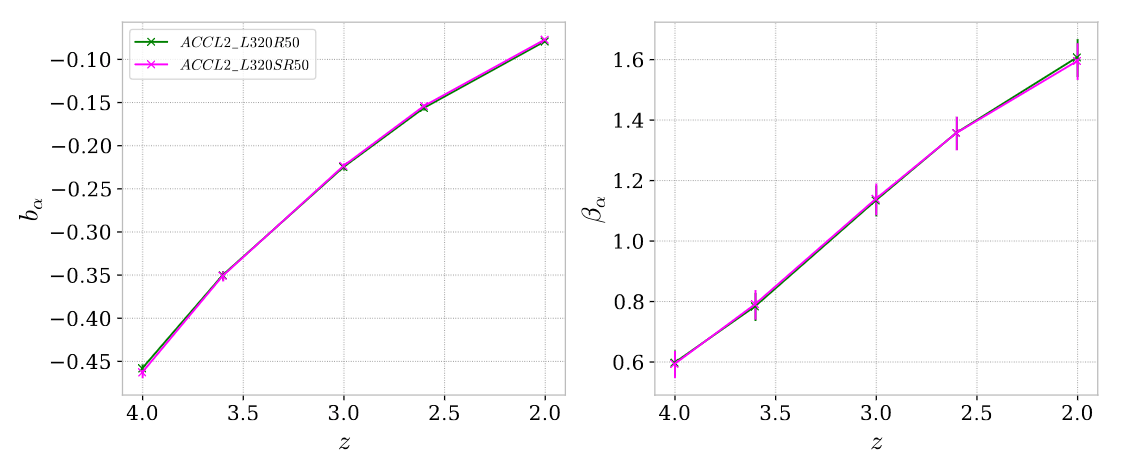
Resulting spliced power spectra