Corentin
Ravoux
I measure how cosmic structure grows and how the Universe expands, from nearby supernovae to the Lyman-α forest.

About
I am a CNRS researcher at the Laboratoire de Physique de Clermont Auvergne (LPCA), working on the large-scale structure of the Universe with spectroscopic and photometric surveys.
My PhD (Université Paris-Saclay, 2022) measured the matter distribution with the Lyman-α forest of eBOSS and of the first DESI data. I started working on peculiar velocities as a postdoc at CPPM in Marseille (2022–2023), and joined the CNRS in November 2023. My work sits at two ends of the same axis: the local Universe, where supernova velocities measure how structure grows today, and the high-redshift intergalactic medium, where the Lyman-α forest measures the matter power spectrum on some of the smallest scales accessible to cosmology.
- DESI
- Builder; co-lead of the Lyman-α software topical group
- Rubin-LSST
- Co-lead of the DESC Peculiar Velocities topical team; member of the DESC collaboration council; AuxTel atmospheric-calibration team
- ZTF
- Type Ia supernova cosmology: growth rate and H₀-dipole analyses
- Supervision
- One PhD co-supervised (C. Barjou-Delayre, 2023–2026); four master's internships co-supervised, one mentored
- Teaching
- Tutorials designed and taught at a French engineering school, a PhD summer school in Mexico and three French summer schools (notebooks)
z ≈ 0.05, the local Universe
Growth of structure from peculiar velocities
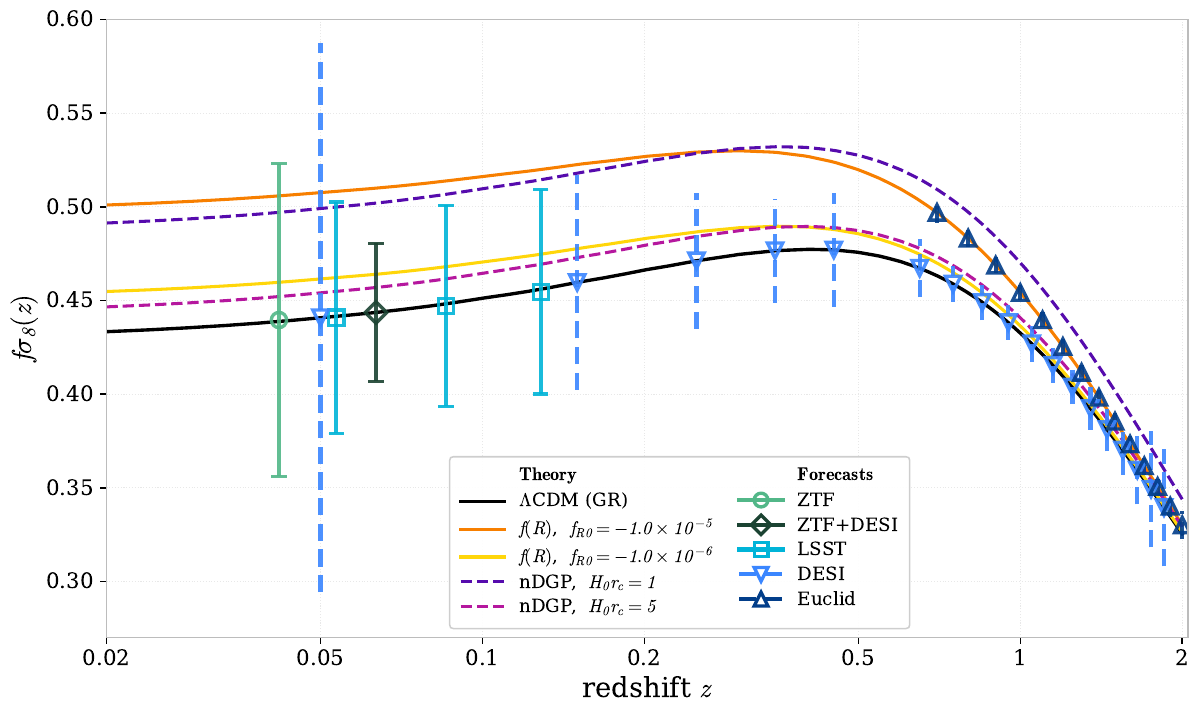
Galaxies fall towards mass. Measure that infall and you measure the growth rate of structure, through the combination fσ₈: a test of gravity on cosmological scales.
Type Ia supernovae are the most precise distance indicators at low redshift (about 6% in distance per object, against about 20% for Tully–Fisher and fundamental-plane galaxies), so the residuals of their Hubble diagram carry the velocity field. I developed a generalised framework for field-level, likelihood-based inference of fσ₈ from velocity and density fields, released as flip and now used in DESI, ZTF and Rubin-LSST DESC. On realistic simulations of six years of ZTF supernovae and the DESI Bright Galaxy Survey (DR3), adding the galaxy density field reduces the uncertainty on fσ₈ by up to 50%, to about 10%, without bias.
For Rubin-LSST, simulations of the full survey show that fσ₈ can be measured to 10% over 0.02 < z < 0.14 in the most realistic case (photometric classification, non-Ia contamination, missing host redshifts), and to better than 18% in each of three redshift bins. I estimated how many host redshifts DESI and 4MOST will provide; intrinsic-scatter modelling turns out to be one of the main systematics.
At that precision, photometric calibration takes over. With the AuxTel team I added Gaia spectra as standard stars for measuring the atmospheric transmission above the Rubin Observatory, alongside the CALSPEC standards, and a master's internship I co-supervised derived corrections that remove most of the residual difference between the two. A paper is in preparation.
z ≈ 0.1, isotropy
Anisotropy and cosmic dipoles
The cosmological principle is an assumption, not a measurement. Supernovae can test it directly.
- error on the H₀ dipole amplitude
- 0.33km s⁻¹ Mpc⁻¹
- error on its right ascension
- 3.4°
- error on its declination
- 6.1°
Recovery of a 3 km s⁻¹ Mpc⁻¹ dipole injected into realistic simulations of the ZTF DR2 supernova sample. arXiv:2601.11139
The same Hubble-diagram residuals that give the velocity field also let you fit the expansion rate as a function of direction. With Chloé Barjou-Delayre, whose PhD I co-supervised, we built a likelihood fit of an H₀ dipole and tested it on realistic simulations of the ZTF sample: the injected dipole is recovered without bias, whatever H₀ is assumed. Peculiar velocities are a major contaminant, because a coherent bulk flow can mimic an expansion dipole, and selection effects in the survey add a systematic error that the error model includes.
z ≈ 0.3–2.3, a standard ruler
Baryon acoustic oscillations with DESI
The sound horizon left a fixed length scale imprinted in the matter distribution. Measuring it at many redshifts, with galaxies and with the Lyman-α forest, turns it into a ruler for the expansion history.
Inside DESI I work on the Lyman-α side of that measurement, the catalogues and the analysis pipeline the forest correlations are built from, and I co-lead the Lyman-α software topical group. That work runs through the DR1 and DR2 Lyman-α BAO analyses. Combined with the CMB and supernovae, the DR2 BAO measurement prefers an evolving dark energy over ΛCDM at 2.8σ to 4.2σ, depending on the supernova sample.
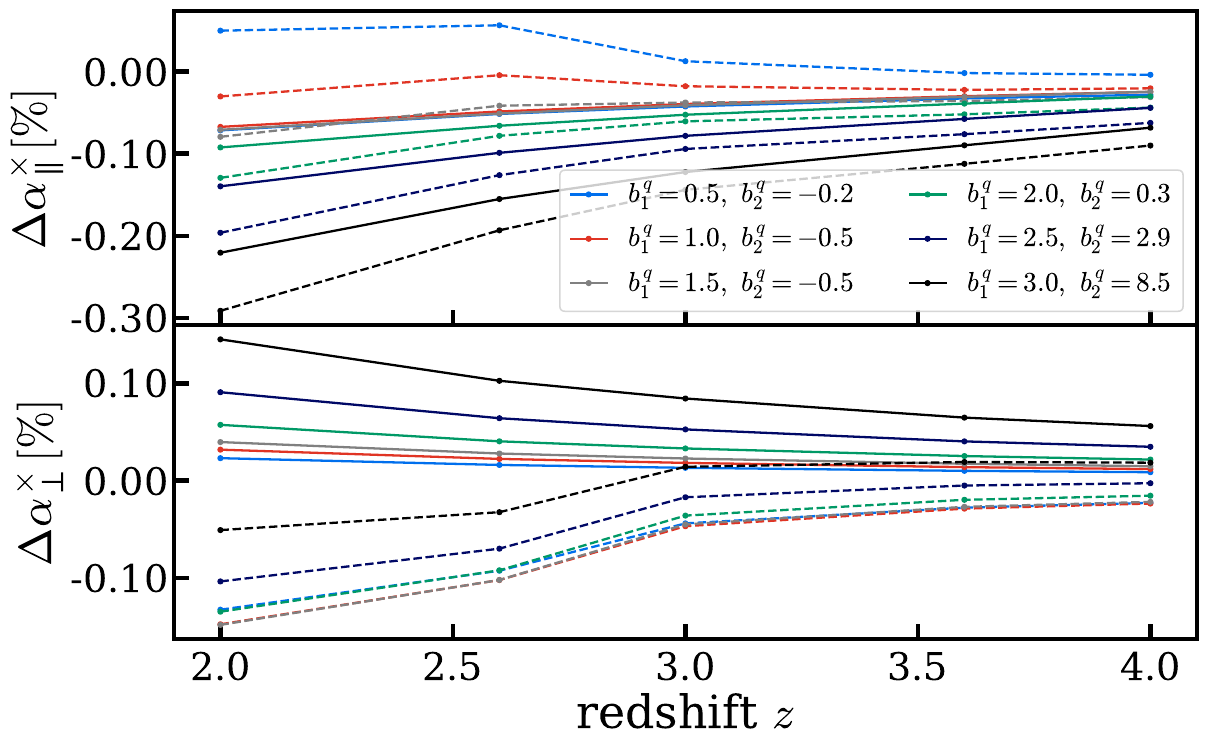
How far does non-linear physics move the peak? On the ACCEL² simulations, which I co-initiated and co-lead, an effective-field-theory analysis led by R. de Belsunce found shifts of the BAO scale of at most 0.3%, for the forest auto-correlation and for its cross-correlation with quasars. That keeps the forest a trustworthy ruler at z ≈ 2.3, and the estimate entered the DESI DR2 Lyman-α BAO and full-shape analyses as their theoretical systematic.
z ≈ 2.5, the intergalactic medium in 3D
Tomographic maps, and the voids inside them
Every distant quasar is a backlight: the neutral hydrogen between us and it absorbs at the Lyman-α wavelength, redshifted, leaving a forest of absorption lines. With enough sightlines close together, the forest becomes a three-dimensional map.
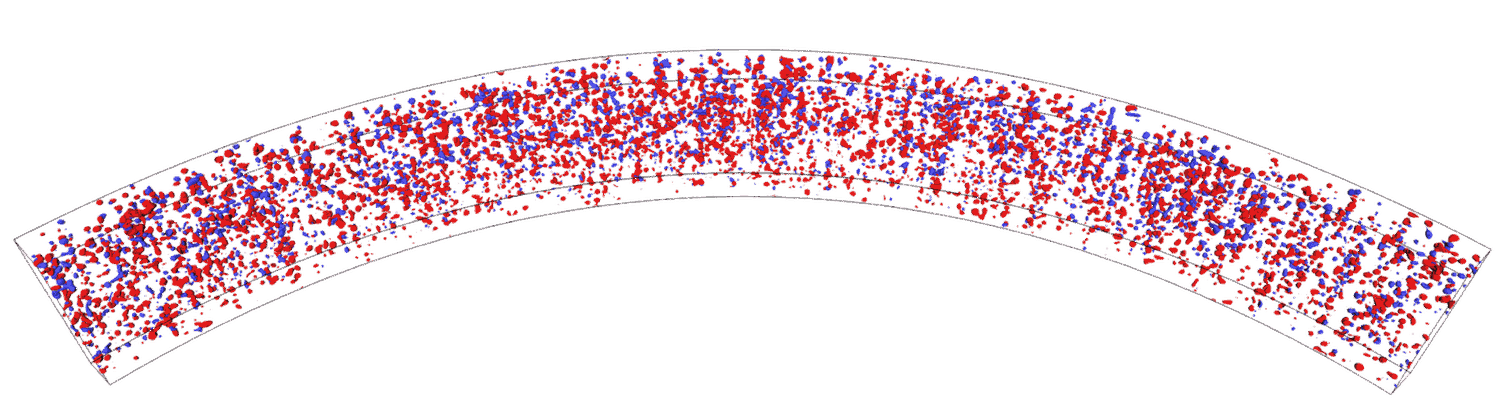
From the eBOSS quasars of the SDSS Stripe 82 field (220 deg², 37 sightlines per square degree), I reconstructed the flux-contrast field between the sightlines with a Wiener filter. The map covers 0.94 h⁻³ Gpc³ at 13 h⁻¹ Mpc resolution, the largest-volume three-dimensional map of matter fluctuations at high redshift. The pipeline is open, as lelantos.
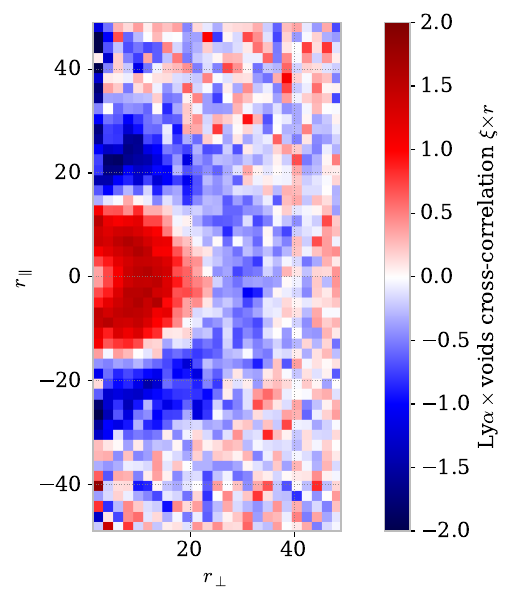
A map lets you ask questions a power spectrum cannot: where are the underdense regions? We identified voids in the map and measured their cross-correlation with the forest. Its quadrupole carries the flow of matter out of the voids: redshift-space distortions detected at 8σ at a median redshift of 2.49, the first detection of flows around voids that far back, with a model that accounts for the sightlines being parallel.
z ≈ 2.2–4.2, the intergalactic medium
The Lyman-α forest power spectrum
Along each sightline, the forest traces the matter distribution down to about 1 h⁻¹ Mpc, smaller scales than any galaxy survey can reach.
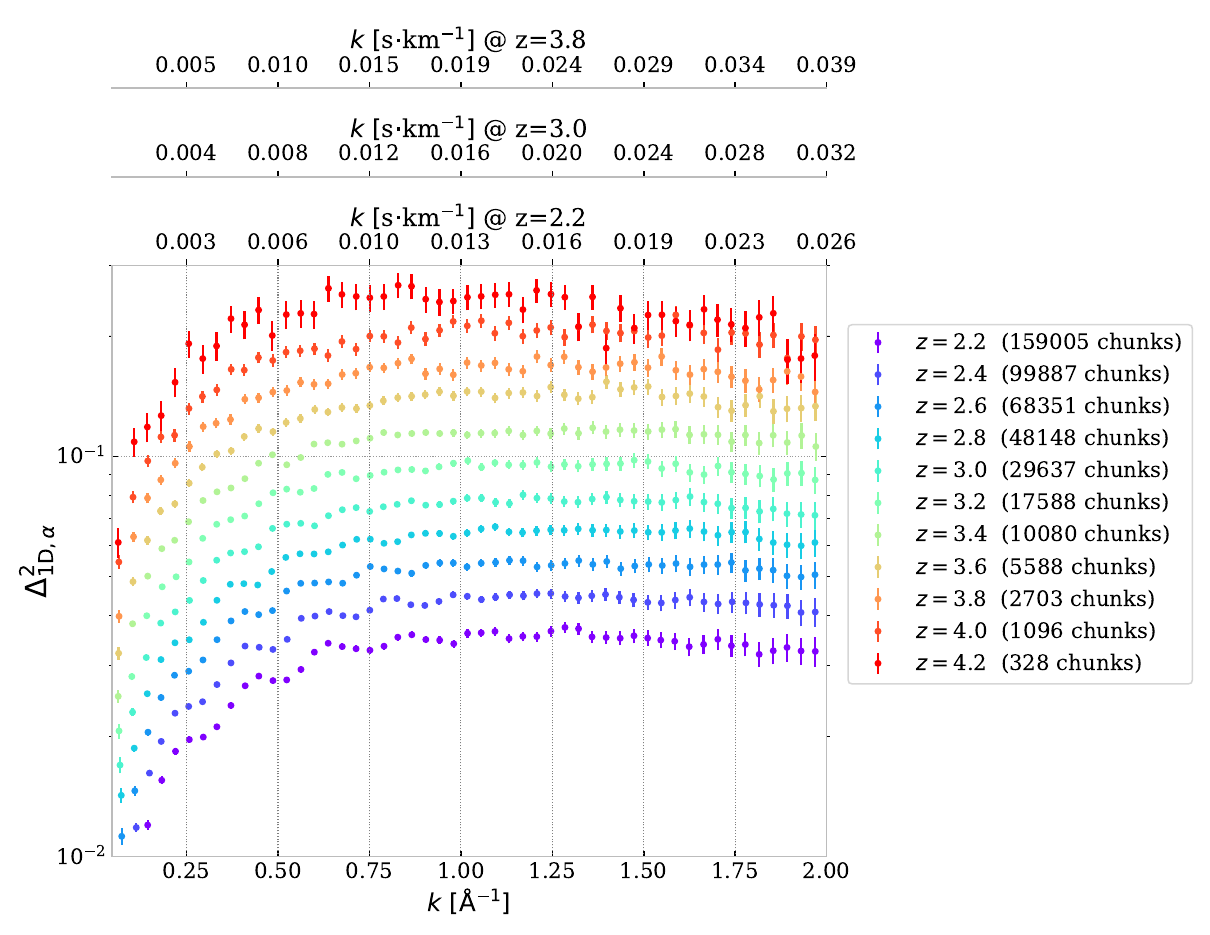
I lead the measurement of the one-dimensional Lyman-α power spectrum, P1D, with the Fast Fourier Transform estimator in DESI: first on the early data (26,330 quasar spectra from the Early Data Release and the first two months of the survey), then on Data Release 1. Together with an independent quadratic estimator, the DR1 measurement is the most precise P1D to date. It constrains the small-scale matter power spectrum and, through it, the running of the primordial spectral index, neutrino masses, warm dark matter and the thermal history of the intergalactic medium.
The DR1 cosmological analysis measures the amplitude and slope of the linear power spectrum at z = 3, Δ²★ = 0.379 ± 0.032 and n★ = −2.309 ± 0.019, and, combined with the CMB and DESI BAO, tightens the constraints on Neff and on the running of the spectral index.
Code I build and maintain
Each measurement above comes with its software. My main packages are open, documented and versioned, with a licence and a Zenodo DOI; the collaboration code I contribute to, such as picca for the DESI Lyman-α analyses, is open too.
Supernovae and peculiar velocities
- flip Field-level likelihood inference of fσ₈ from velocity and density fields: analytic wide-angle covariances, JAX acceleration, emulators and survey Fisher forecasts. Used in DESI, ZTF and Rubin-LSST DESC.
- desidescsn Which Rubin-LSST supernova hosts DESI and 4MOST can give a redshift: spectroscopic efficiencies from DC2 and survey target selections.
- gaiaspec Gaia low-resolution spectra loaded and formatted as standard stars for the AuxTel atmospheric-transmission pipeline.
- growth_review Compiled fσ₈, BAO and S₈ constraints with the plotting layer behind the review figures, plus an EFTCAMB modified-gravity backend.
Lyman-α forest
- p1desi The DESI Lyman-α P1D measurement with the FFT estimator: noise, resolution and metal corrections, systematics and covariance, built on picca outputs.
- lelantos Lyman-α tomography: from flux contrast to Wiener-filtered 3D maps of the intergalactic medium, and the voids inside them.
- lyavoid Cross-correlation of the Lyman-α forest with voids detected in tomographic maps.
- lyapower Fitting the 3D Lyman-α power spectrum and its BAO in Nyx hydrodynamic simulations, with splicing across resolutions.
Recent papers
My most recent papers with a major contribution, marked ●. The full list, generated from INSPIRE-HEP, also includes collaboration papers.
- 2026 Field-level inference of growth rate from DESI BGS galaxy and ZTF supernova simulations
- 2026 Analytic compression of the effective field theory of the Lyman-α forest
- 2026 Emulating galaxy and peculiar velocity clustering on non-linear scales
- 2026 Cosmological analysis of the DESI DR1 Lyα 1D power spectrum
- 2026 Study of the anisotropy of cosmic expansion on ZTF type Ia supernovae simulations
- 2025 DESI DR1 Lyα 1D power spectrum: Validation of estimators